Read more about the article Stochastic Oscillator Technical Trading
Stochastic Oscillator Analysis in Technical Trading

Stochastic Oscillator Technical Trading

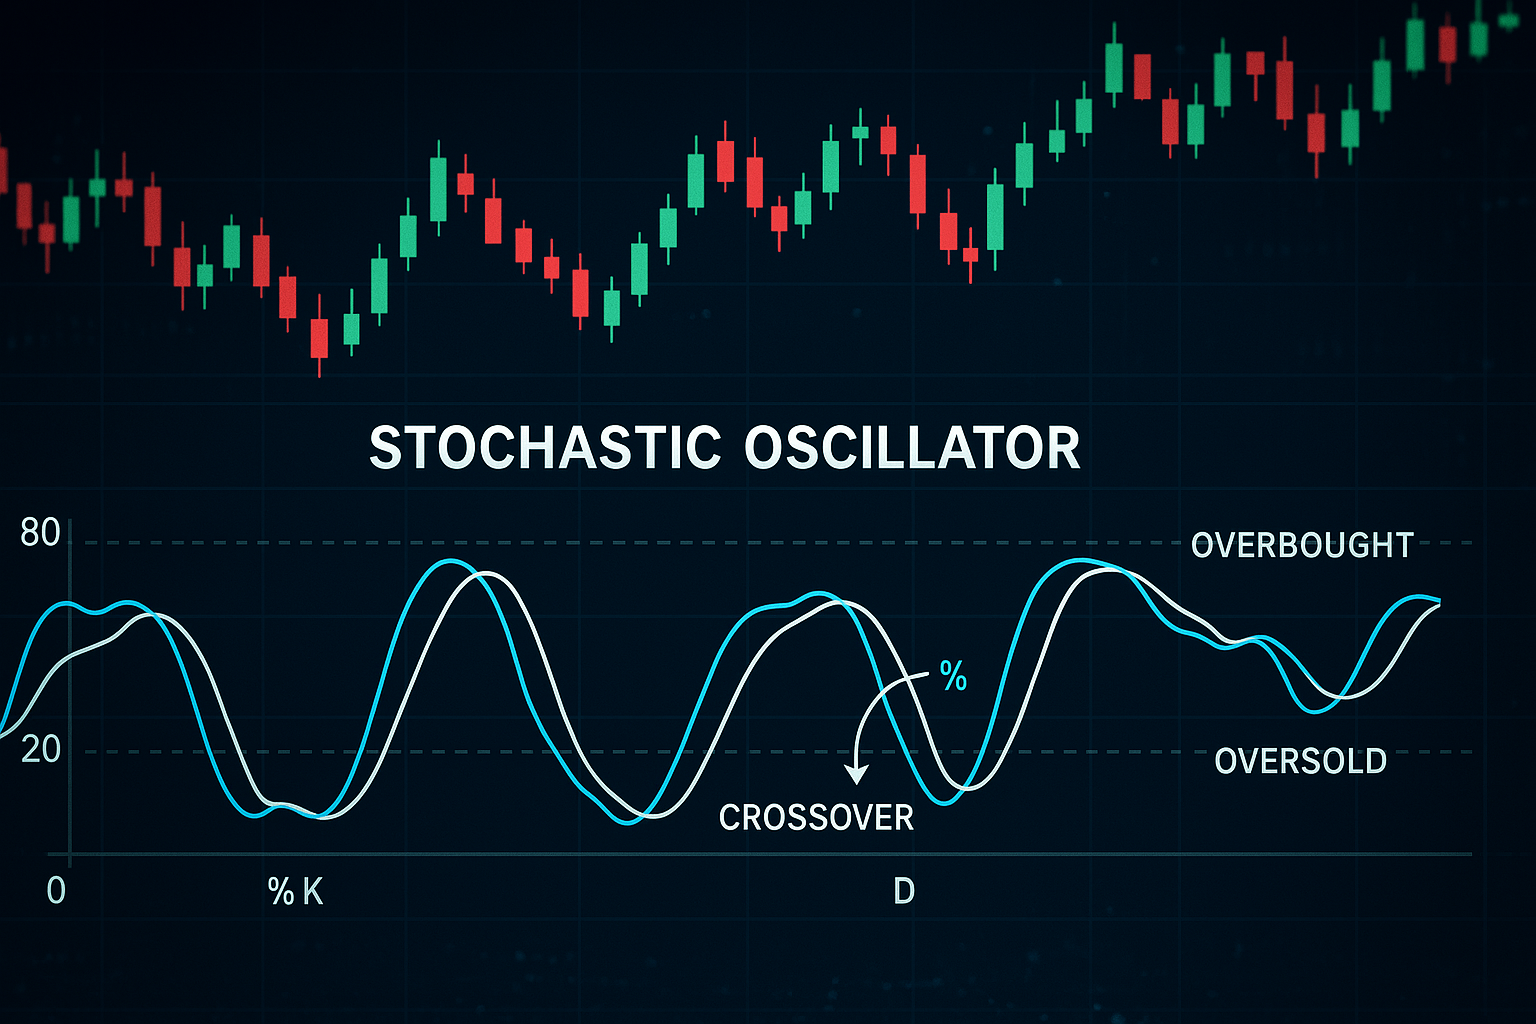
Stochastic Oscillator — ને સરળ ગુજરાતી ભાષામાં સમજીએ. 📘 સ્ટોકાસ્ટિક ઓસિલેટર શું છે? Stochastic Oscillator એ એક momentum indicator છે, જે બતાવે છે કે કોઈ સ્ટોકની હાલની કિંમત તેના કેટલાક…

Continue ReadingStochastic Oscillator Technical Trading
Read more about the article MACD Indicator Explained
Visual guide to understanding the MACD trading strategy

MACD Indicator Explained

Moving Average Convergence Divergence 🧠 MACD શું છે? MACD એ એક ટ્રેન્ડ-ફોલોઇંગ અને મોમેન્ટમ ઈન્ડિકેટર છે, જે બે મૂવિંગ એવરેજ વચ્ચેનો તફાવત બતાવે છે.તેમાં મુખ્યત્વે ત્રણ ઘટકો હોય છે: MACD…

Continue ReadingMACD Indicator Explained
Read more about the article ADX IndicatoR – The Power of ADX in Technical Analysis
ADX Explained: A Trader's Guide

ADX IndicatoR – The Power of ADX in Technical Analysis

🧠 ADX શું બતાવે છે? ADX ટ્રેન્ડ છે કે નહીં અને ટ્રેન્ડની તાકાત કેટલી છે, એ બતાવે છે.નોંધો: ADX માત્ર ટ્રેન્ડની તાકાત બતાવે છે, દિશા (ઉપર કે નીચે) નથી બતાવતો.…

Continue ReadingADX IndicatoR – The Power of ADX in Technical Analysis
Read more about the article Moving Average Indicator – A Visual Guide to Trend Analysis
Moving Average Indicator: A Visual Guide to Trend Analysis

Moving Average Indicator – A Visual Guide to Trend Analysis

(Moving Average) ઇન્ડિકેટર વિશે ગુજરાતી ભાષામાં વિગતવાર માહિતી આપવામાં આવી છે: મૂવિંગ એવરેજ શું છે? મૂવિંગ એવરેજ એ એક ટેક્નિકલ ઇન્ડિકેટર છે જે સ્ટૉક, ક્રિપ્ટો, કોમોડિટીઝ વગેરેના ભાવમાં લાંબા ગાળાની…

Continue ReadingMoving Average Indicator – A Visual Guide to Trend Analysis
Read more about the article Mutual Fund SIP અને Direct Stock SIP
Mutual Fund SIP vs Direct Stock SIP – Which One Should You Choose? In today’s financial world, investing smartly is more important than ever. SIP, or Systematic Investment Plan, allows you to invest a small fixed amount regularly, helping you build long-term wealth step by step.

Mutual Fund SIP અને Direct Stock SIP

Mutual Fund SIP અને Direct Stock SIP વચ્ચેનો તફાવત 📌 Mutual Fund SIP શું છે? SIP (Systematic Investment Plan) એ નિયમિત રીતે નાણાં રોકાણ કરવાની પદ્ધતિ છે. Mutual Fund SIP…

Continue ReadingMutual Fund SIP અને Direct Stock SIP
Read more about the article RSI – A Powerful Tool to Spot Market Momentum
This chart illustrates how the Relative Strength Index (RSI) helps identify overbought and oversold market conditions, with key levels marked at 70 and 30 for trading decisions." Would you like a more technical version, or something simpler for beginners?

RSI – A Powerful Tool to Spot Market Momentum

🔍 RSI શું છે? Relative Strength Index (RSI) એ એક momentum oscillator 📈 RSI કેવી રીતે કામ કરે છે? RSI સામાન્ય રીતે 14 દિવસના સમયગાળાનો ઉપયોગ કરે છે. તે માપે…

Continue ReadingRSI – A Powerful Tool to Spot Market Momentum
Read more about the article શેર બજારમાં રોકાણ કરવું છે? – Want to invest in the stock market?
stock market basic photos

શેર બજારમાં રોકાણ કરવું છે? – Want to invest in the stock market?

* સ્ટોક માર્કેટ શું છે ? સ્ટોક માર્કેટ એ એવી જગ્યા છે જ્યાં કંપનીઓના શેર (હિસ્સેદારી) ખરીદવામાં અને વેચવામાં આવે છે. કંપની પોતાનું મૂડી એકત્ર કરવા માટે શેર જાહેર કરે…

Continue Readingશેર બજારમાં રોકાણ કરવું છે? – Want to invest in the stock market?