
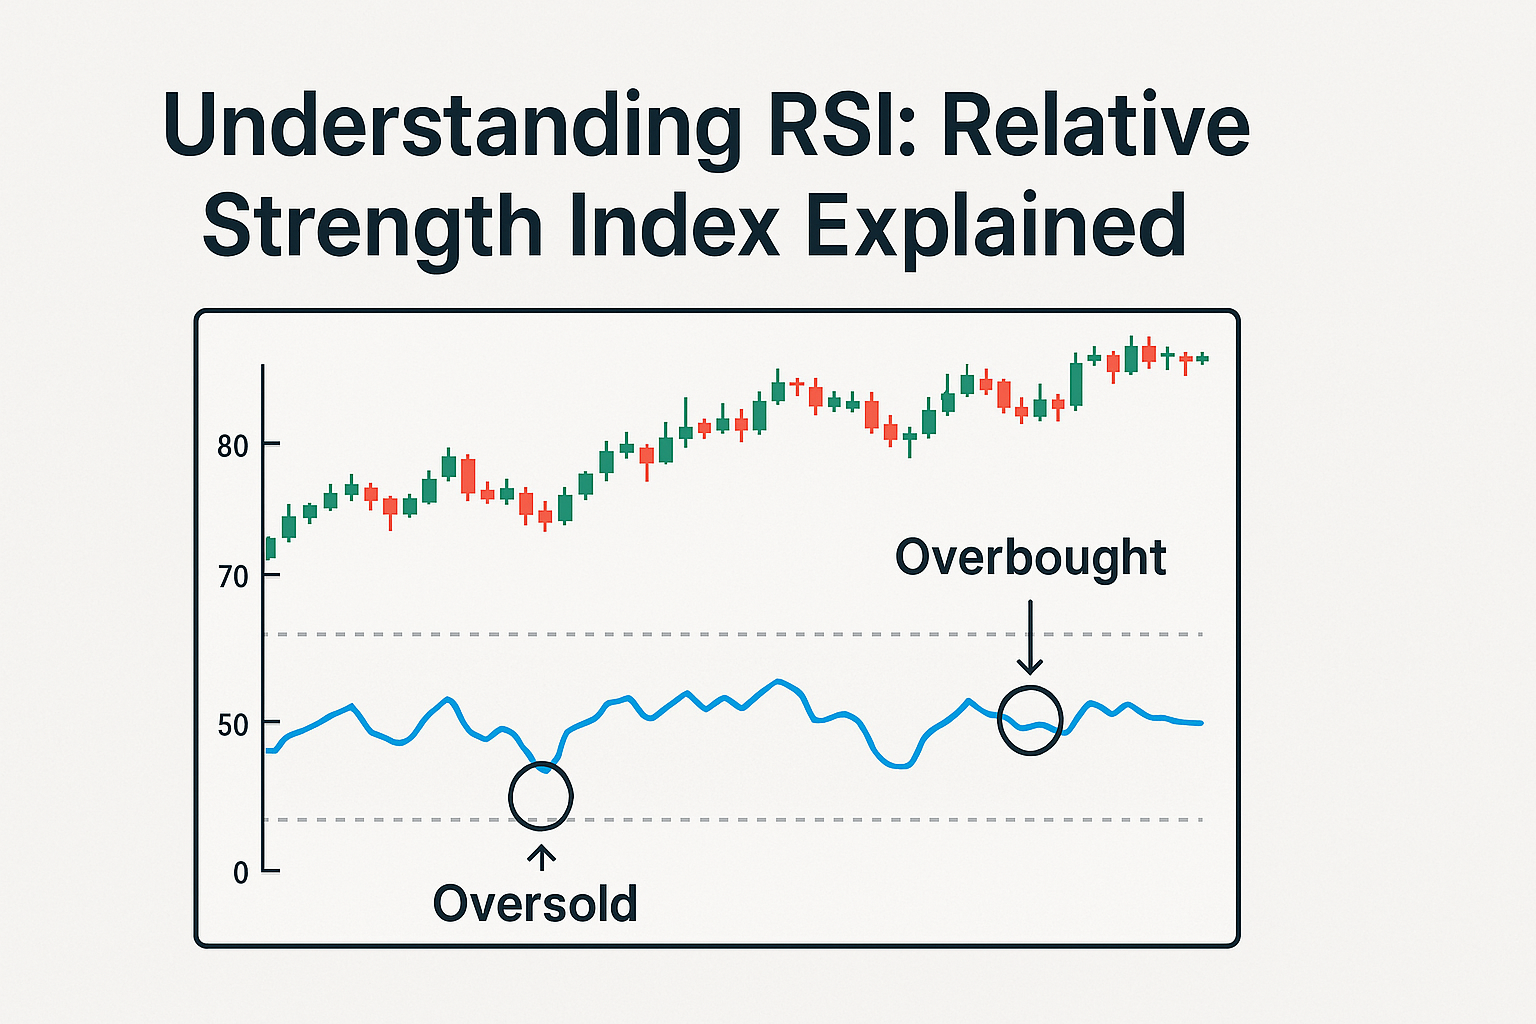
This chart illustrates how the Relative Strength Index (RSI) helps identify overbought and oversold market conditions, with key levels marked at 70 and 30 for trading decisions."
Would you like a more technical version, or something simpler for beginners?
RSI – A Powerful Tool to Spot Market Momentum
🔍 RSI શું છે? Relative Strength Index (RSI) એ એક momentum oscillator 📈 RSI કેવી રીતે કામ કરે છે? RSI સામાન્ય રીતે 14 દિવસના સમયગાળાનો ઉપયોગ કરે છે. તે માપે…